


Over the past twelve years, we have had the privilege of collaborating with a diverse array of organisations and governments. Together, we have crafted and delivered remarkable software that has made a positive impact on the lives of millions of Australians.
Our projects predominantly leverage data visualisation and, in most cases, artificial intelligence. A common thread across all our projects is the creation and delivery of innovative, first-of-their-kind solutions that are designed to be user-friendly and accessible to everyday people.
We take great pride in the long-term relationships we have cultivated with the majority of our clients, with many of our projects spanning over five years. These enduring partnerships are a testament to our commitment to our clients and the collaborative work we have accomplished together. Here is a selection of our clients and a glimpse into the work we have undertaken with them.
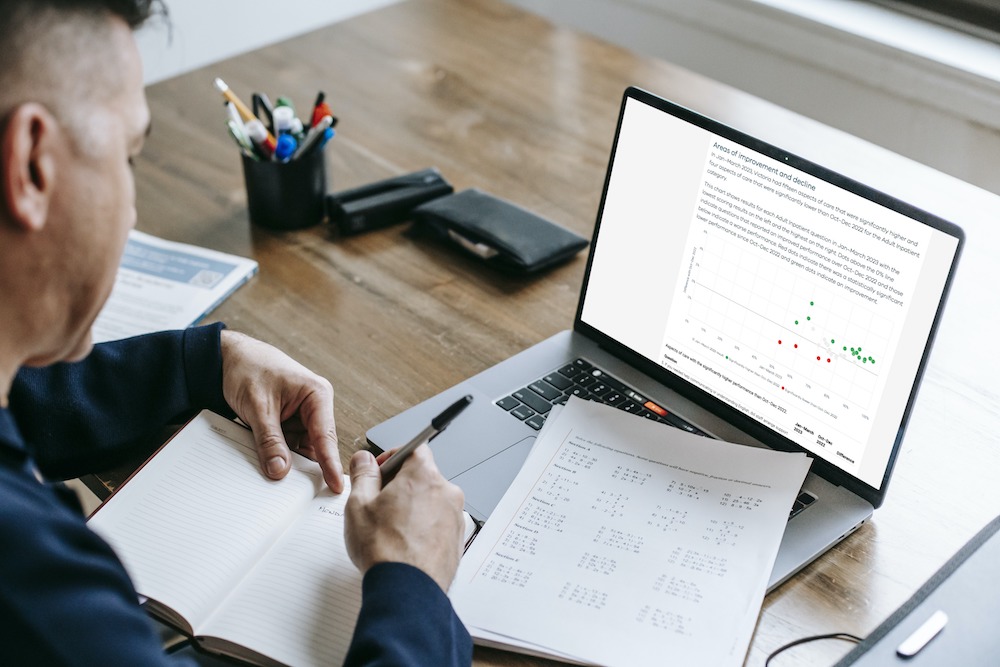
Beginning in 2014, Flink Labs has been at the helm of managing and delivering the Victorian Healthcare Experience Survey (VHES) results portal. This extensive project entails reporting on over 50 million data points for more than 700,000 patients across Victoria.
In addition to this, we have designed and delivered the Victorian Mental Health Patient Experience portal, the New Zealand Patient Experience Surveys portal, and the Queensland Health patient experience portal. Our extensive experience and commitment to these projects underscores our dedication to enhancing healthcare experiences through data-driven insights.
A.I. Data Visualisation
By integrating supermarket trolley tracking data with point of sale purchase information, we employed Markov chain analysis to delineate patterns of shopper movement within a supermarket. This strategic analysis allowed us to identify key behavioural patterns among shoppers.
The insights derived from this analysis were instrumental in optimising store layout and product placement. The end result was a noticeable increase in average basket spend, demonstrating the efficacy of our data-driven approach to enhancing retail performance.
A.I. Data Visualisation

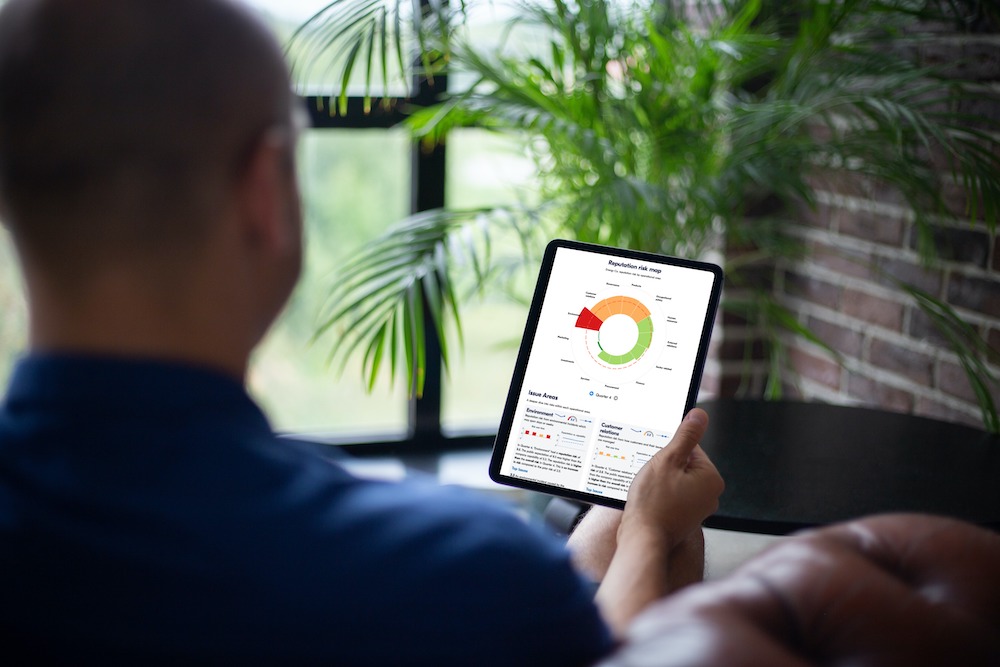
In collaboration with a premier reputation management consultancy in Melbourne, Flink Labs has meticulously crafted an interactive reporting portal. This innovative platform visually represents the pivotal risks and concerns that organisations may encounter in relation to their reputation.
Our interactive data portal offers an extensive range of data exploration tools. This provides users with a multitude of methods to comprehend and address their key issues. We have carefully designed this to ensure that our clients can easily navigate and utilise the portal to their advantage.
Data Visualisation
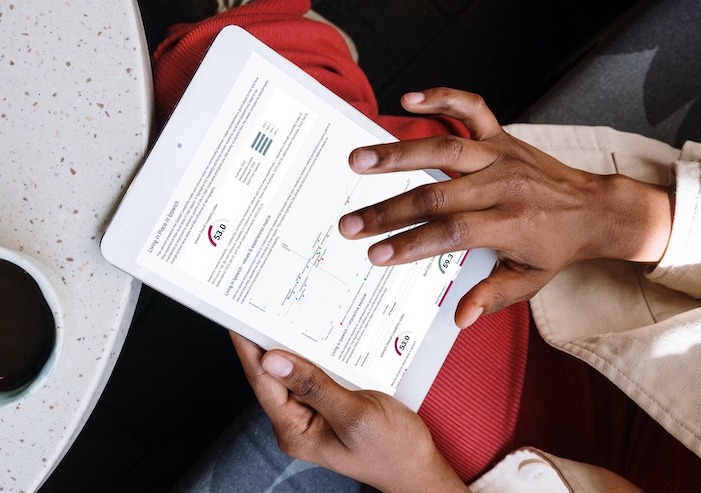
Utilising the robust capabilities of our Pikalo data portal product, we have engineered a novel reporting platform for ID Consulting. This platform delivers an array of data visualisations and valuable insights, illuminating the perspectives of communities across councils within Australia. In 2022, ID Consulting strategically acquired Pikalo from Flink Labs, further solidifying our successful partnership.
A.I. Data Visualisation
In collaboration with IBM's advertising partner, Flink Labs designed and developed Altlas, an innovative interactive world map that dynamically reshapes countries based on data inputs.
Altlas comes equipped with a set of world data sets, and also provides users the functionality to upload their own global data, offering a visual representation of its impact over time. This interactive tool utilises a unique hexagram-based cartogram that dynamically adjusts the size of each country in accordance with the data.
The project showcases a cutting-edge approach to data visualisation, with Altlas operating entirely within the browser and dynamically calculating the shapes and sizes of countries in real-time. This initiative marks a significant step forward in the realm of data-driven cartography, highlighting our commitment to harnessing technology for innovative data visualisation solutions.
Data Visualisation

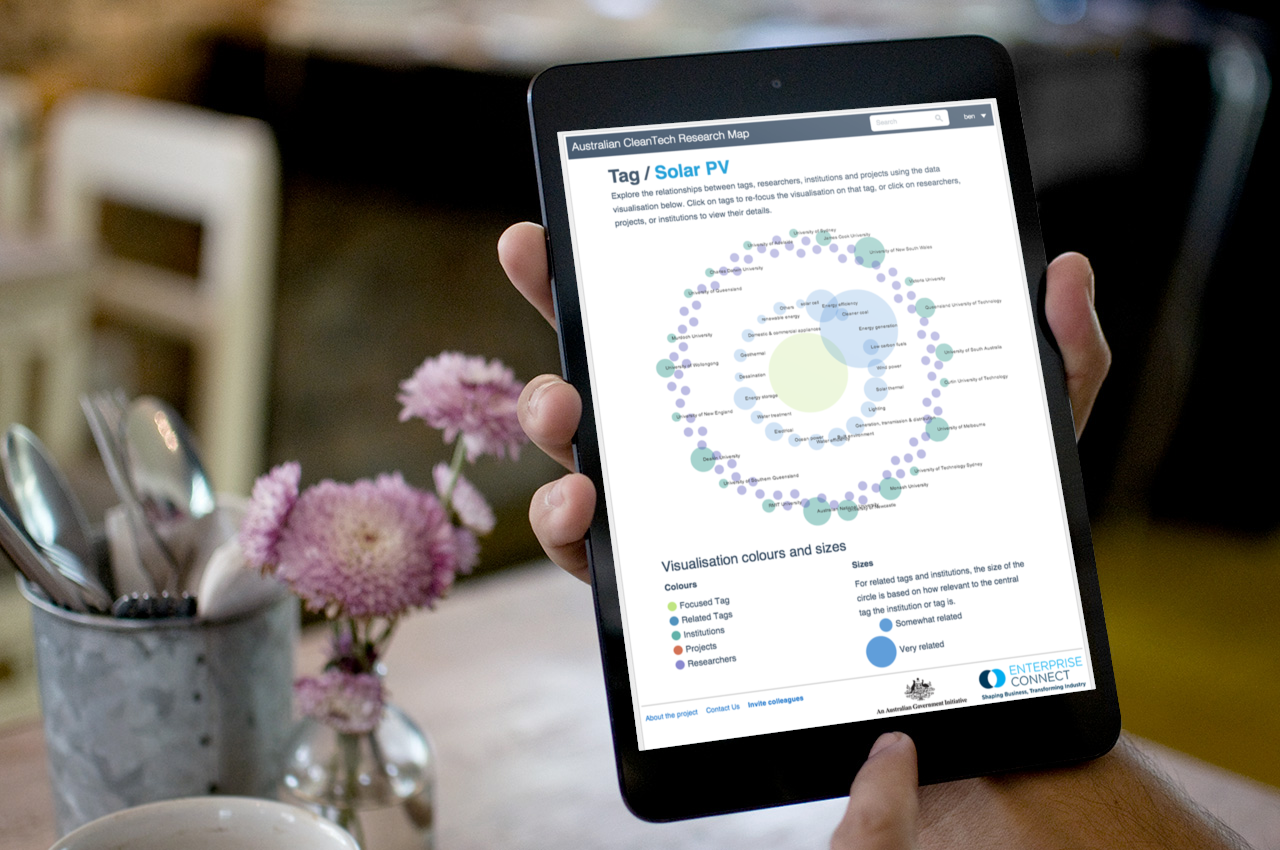
The Australian CleanTech Research Map, a pioneering online portal, empowers clean technology researchers to showcase their expertise and projects. This portal serves as a valuable resource for commercial business partners, enabling them to delve into and explore the clean technology landscape, thereby enhancing the commercialisation potential of clean-tech research.
Flink Labs is proud to have designed and constructed this portal, which includes comprehensive visualisations. We have integrated multiple navigation and data filtering options, ensuring a user-friendly experience that allows users to effortlessly sift through the data.
A.I. Data Visualisation
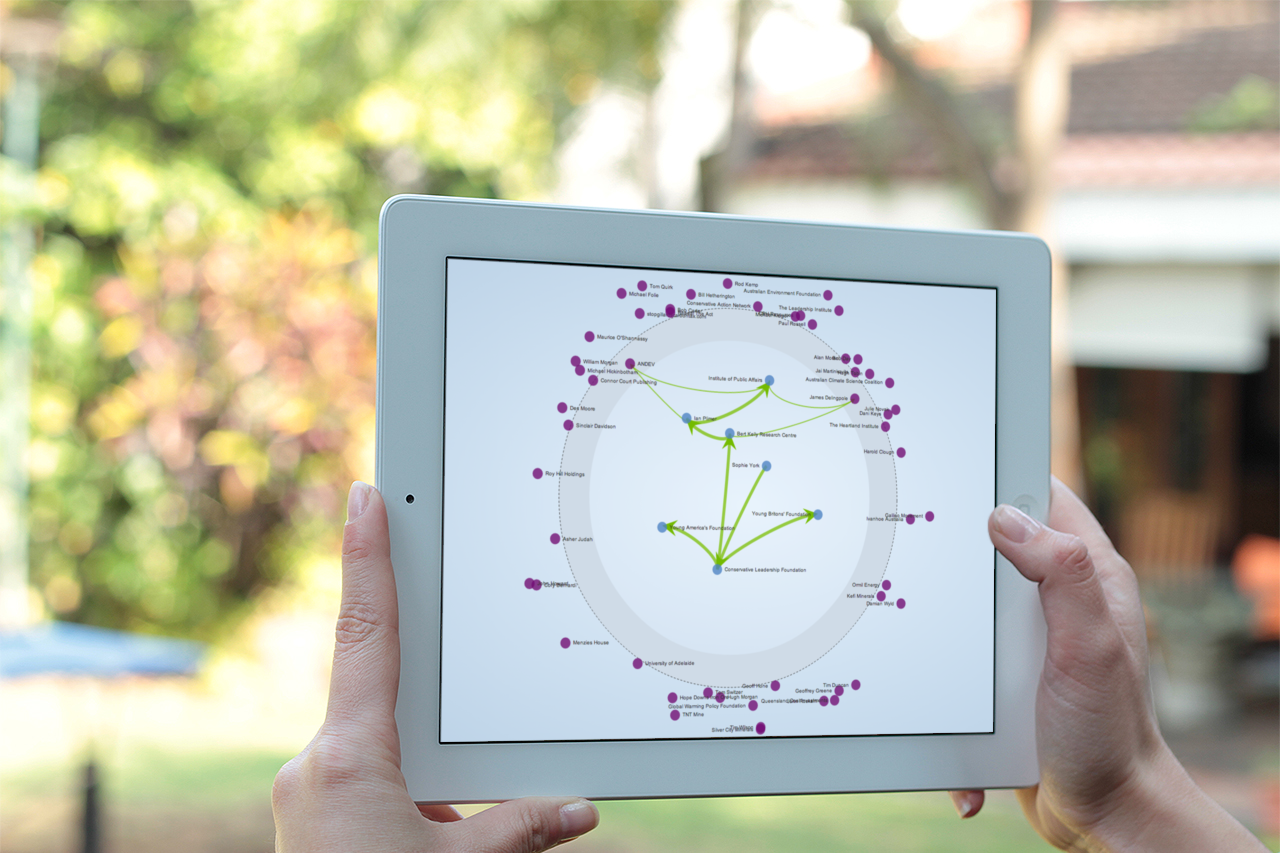
In a collaborative effort with a distinguished Australian journalist, we developed an interactive tool that offers users the ability to search for individuals (for instance, John Howard) or organisations (such as energy companies). This tool uncovers the concealed connections between various parties.
The tool illuminates the links between two parties, whether directly or through a third party. The data forming these links was meticulously curated by hand. The resultant application provides journalists and other interested parties with a clear view of the political landscape surrounding climate denialism in Australia.
Data Visualisation
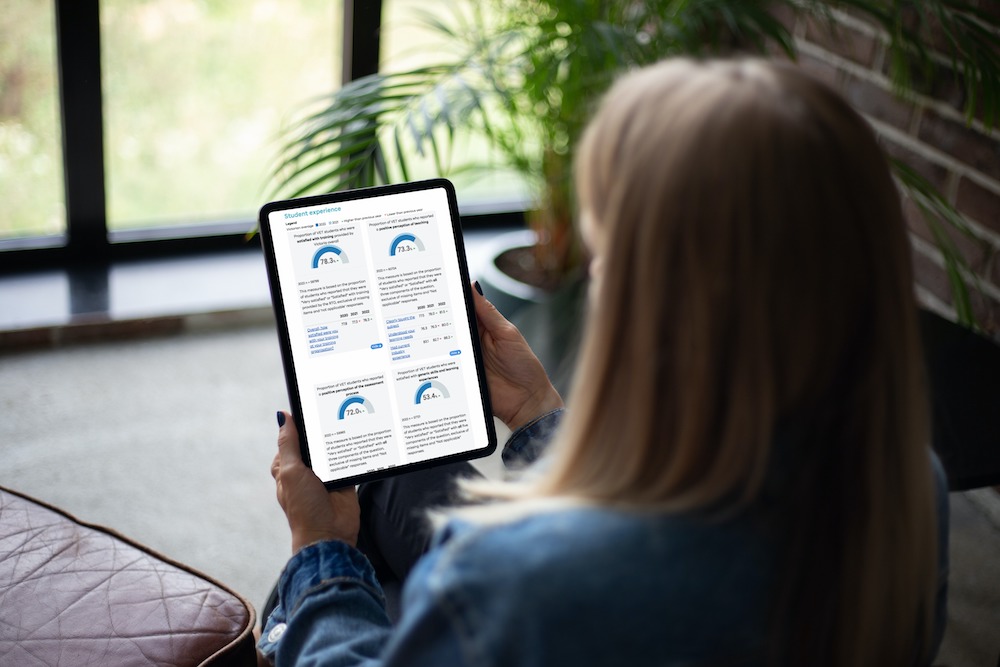
As part of our continuous collaboration with the Victorian Department of Education and Training, we have developed the VETStat portal. This platform offers an extensive suite of visualisations, showcasing the performance of training organisations from both the Student and Employer perspectives.
The portal presents both historical and current results, enabling training organisations to swiftly comprehend their key performance indicators. Additionally, they can delve into the detailed results of performance surveys. This dual-pronged approach ensures that organisations have all the information they need to continually enhance their performance.
Data Visualisation
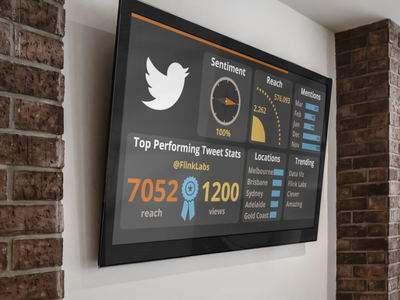
In collaboration with Origin Energy and their social media team, Flink Labs has designed and implemented a series of animated visualisations. These have been deployed on a series of large screens within their office premises.
These real-time visualisations extract data directly from various social media sources, providing a comprehensive analysis of the social media landscape. This includes sentiment analysis, natural language processing, and network analysis. Our aim is to offer a holistic view of the social media environment, thereby enabling more informed decision-making.
A.I. Data Visualisation
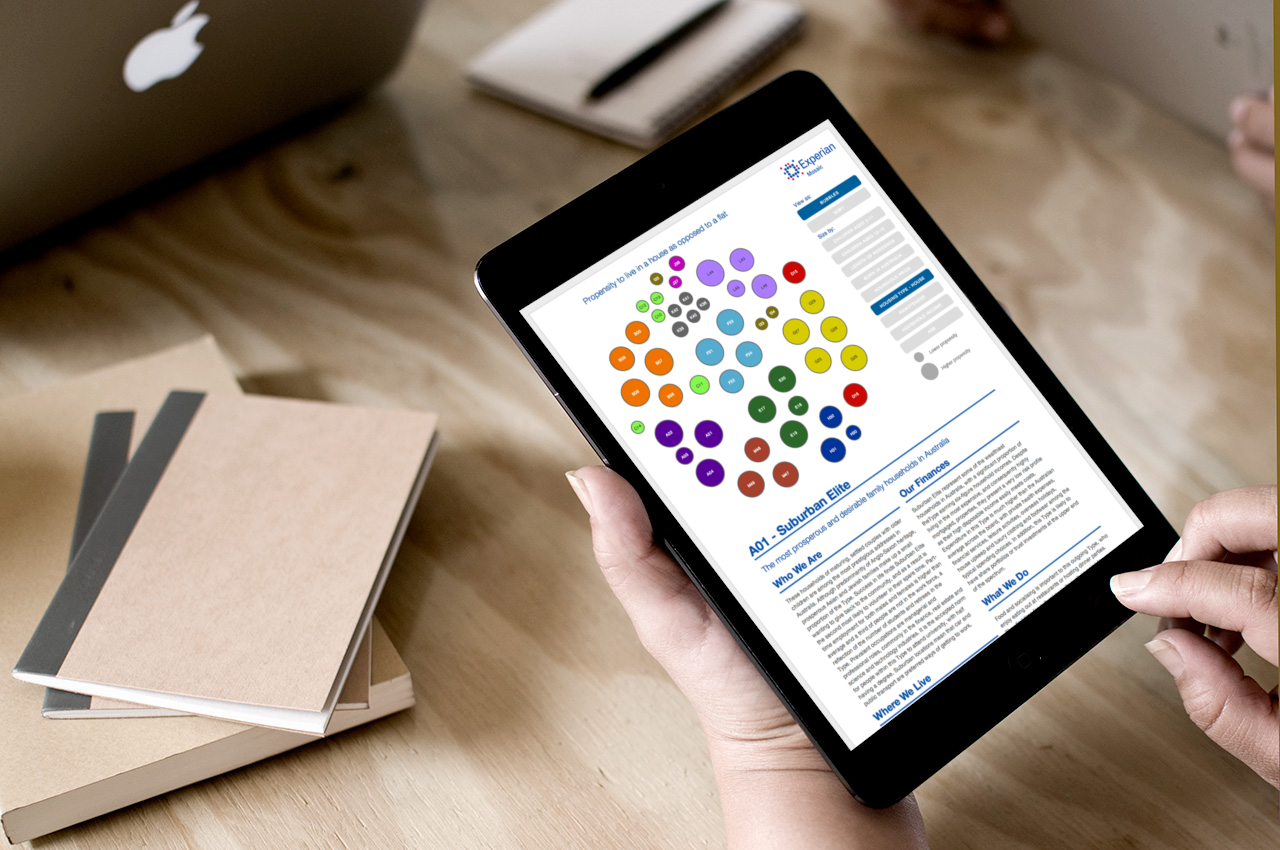
In a productive partnership with Experian, Flink Labs has developed an interactive visualisation of their consumer demographic information. The resultant visualisation offers customers an engaging method to interact with the data, enabling them to explore demographic segments in a novel and enjoyable manner. Our goal is to transform data interaction into a playful experience, making it more accessible and appealing to users.
Data Visualisation
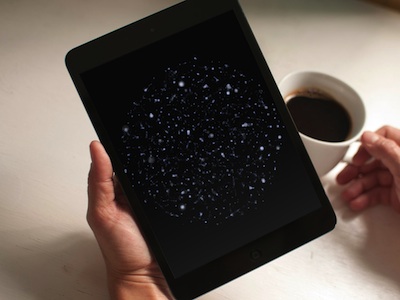
In the context of our early project with HotFrog, a premier online business search index, Flink Labs undertook an advanced data mining project aimed at creating a cluster-based view of businesses in Australia.
The outcome was a constellation-style map that visually represents businesses and their interrelations. For instance, it shows lawyers in proximity to accountants and builders close to plumbers.
This distinctive interactive tool offers analysts a mechanism to unearth hidden relationships between businesses, thereby enhancing their online service. Our aim is to equip analysts with the tools they need to make informed decisions and improve their service offerings.
A.I. Data Visualisation
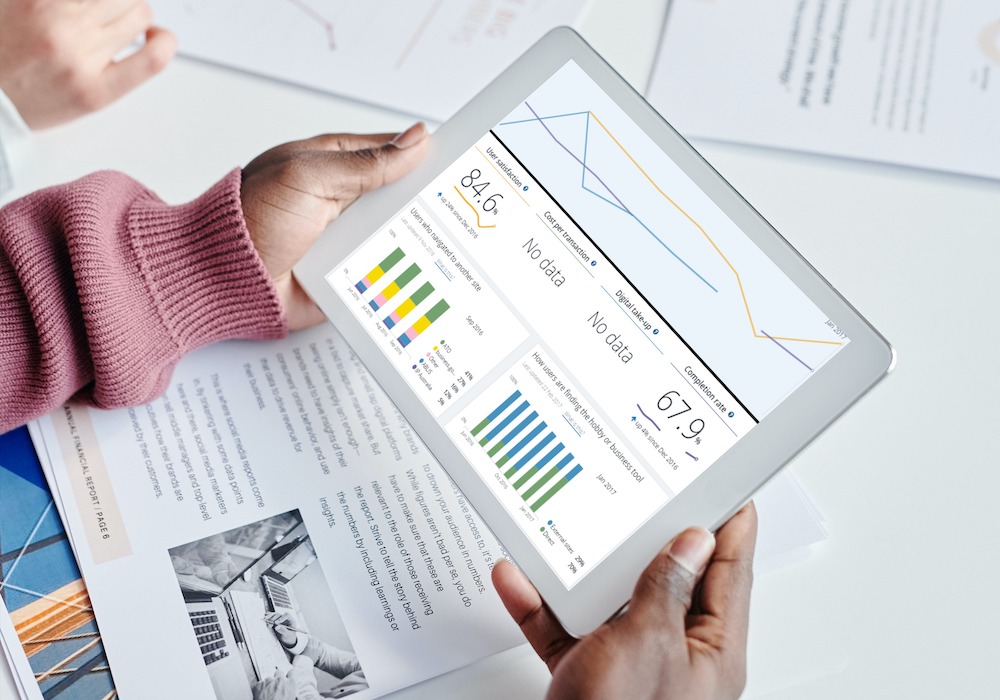
At Australia's Digital Transformation Agency, Flink Labs took the lead in data visualisation for the Australian government's comprehensive performance Dashboard. As part of a cross-functional team, we delivered the dashboard in an unprecedented timeframe. This exceptional achievement was recognised with awards for digital products within the government sector. Our commitment to excellence and swift execution underlines our dedication to driving digital transformation within the government.
Data Visualisation
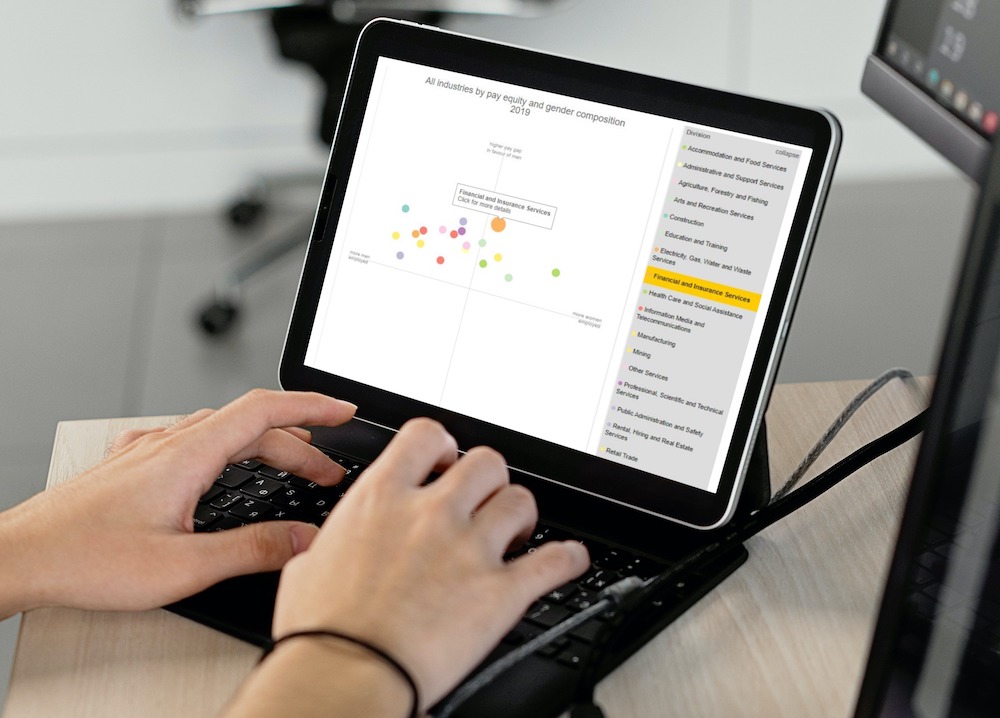
From 2013 to 2022, Flink Labs successfully executed the Workplace Gender Equality Agency's Data Explorer project. This comprehensive census encompasses over 4 million employees across Australia, representing 40% of the total workforce. The project underscores key statistics related to gender equality, pay equity, and other vital equality metrics. Our commitment to this project underscores our dedication to promoting equality in the workforce through data-driven insights.
Data Visualisation
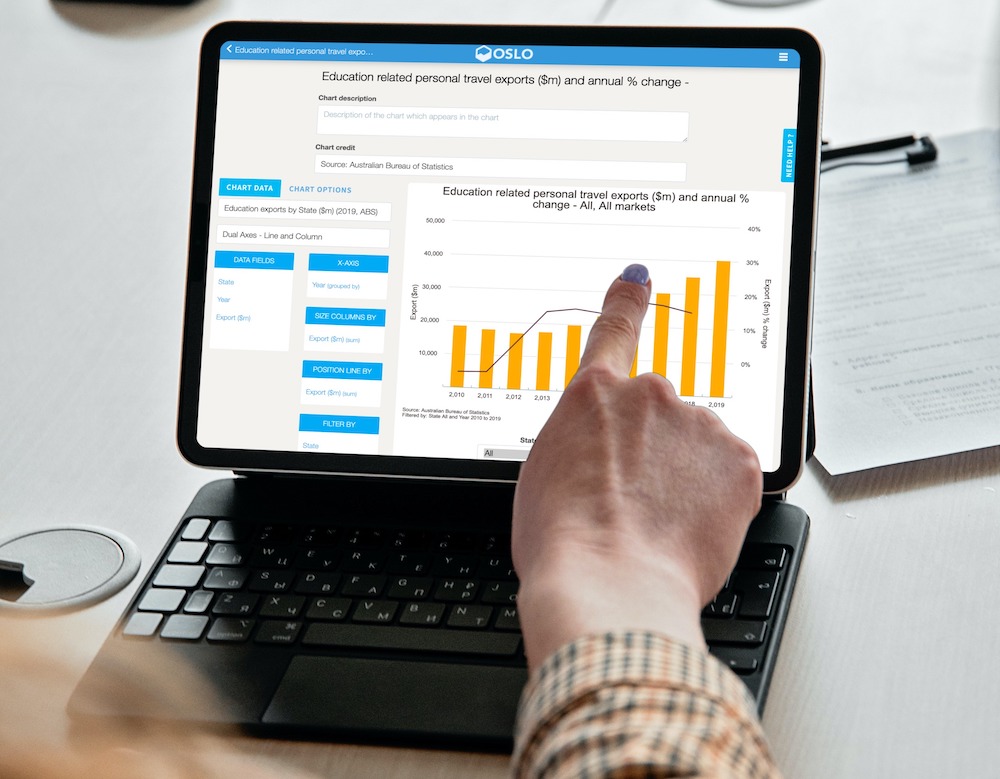
Leveraging Flink Labs's advanced Oslo online data visualisation and data intelligence tool, we constructed Austrade's MIP Orbis. This platform empowers Australian stakeholders to create interactive dashboards, offering visual representations of student enrolments and visa grants for specific markets, among other data points.
Since its launch, MIP Orbis has received overwhelmingly positive feedback. The access rate of this tool has increased nearly tenfold compared to the download rate of the previous pivot tables, as noted by Sonal Srivastava, the MIP Orbis Product Manager. This significant upturn in usage signifies the tool's effectiveness and user-friendly design.
Data Visualisation
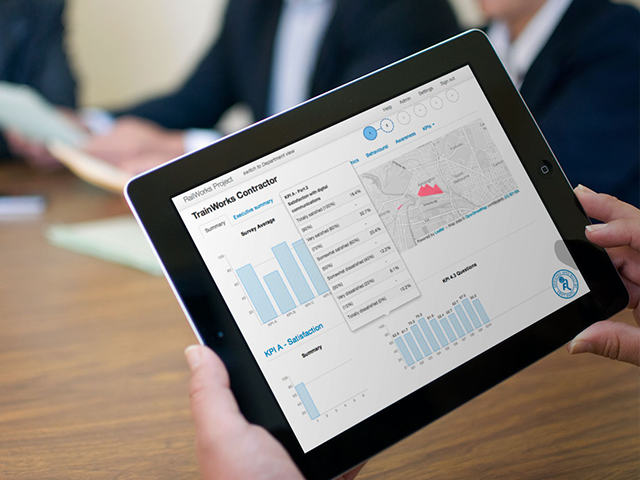
In collaboration with Ipsos and the Regional Rail Link organisation in Victoria, Flink Labs has designed and developed an online portal that reports on contractor performance across multiple project sites around Melbourne.
The portal collects case-based data and constructs temporal results and key performance indicators. These provide the Regional Rail Link organisation with a definitive set of measures and results, serving as the basis for awarding performance bonuses to contractors. Our goal is to ensure transparency and reward outstanding performance, thereby fostering a culture of excellence.
Data Visualisation
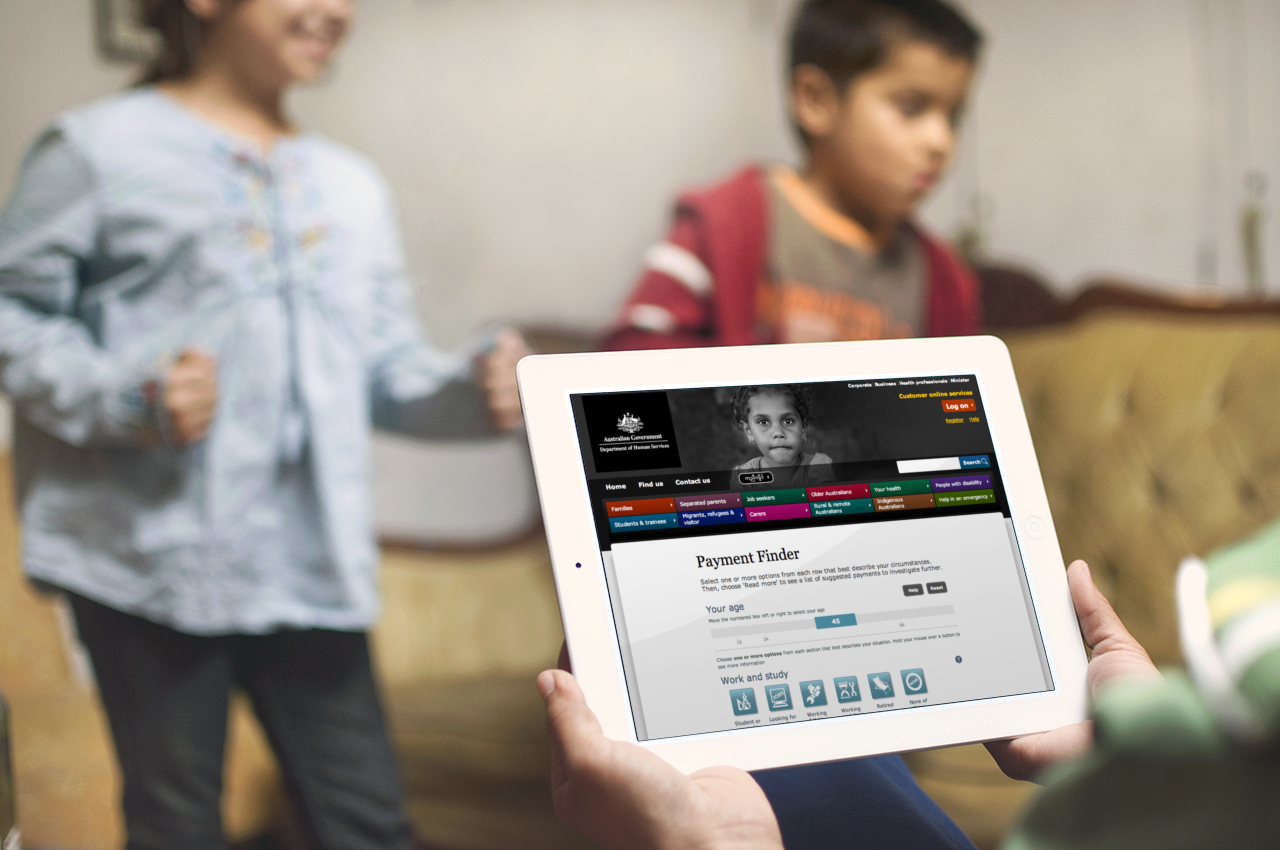
In a productive collaboration with the Australian Government’s human services department, Flink Labs developed an interactive tool designed to guide users in easily locating government payments for which they qualify.
The Australian Government offers a vast array of payments to eligible Australians. However, understanding the availability of these payments and the application process can often be challenging.
To address this, Flink Labs created an interactive tool that filters payments based on eligibility criteria. This tool significantly reduces the time vulnerable Australians spend searching for relevant payments, thereby streamlining the process and making it more user-friendly.
Data Visualisation
In partnership with IP Australia, Flink Labs leveraged advanced Artificial Intelligence techniques, specifically Natural Language Processing (NLP) and Image Recognition, to analyse patent applications. We meticulously extracted metadata and structure from these applications, which were then utilised in sophisticated deep learning pipelines.
This AI-powered approach enables a deeper understanding of the patent applications, enhancing the efficiency and accuracy of the analysis process. The extracted data serves as a rich resource for training deep learning models, further enhancing their predictive capabilities.
Additionally, we employed text classification and clustering algorithms to aid trademark examiners in assessing applications. These AI techniques help in identifying patterns and categorising applications effectively, thereby streamlining the assessment process and reducing the time and effort required.
By integrating AI into these processes, Flink Labs is at the forefront of driving innovation in patent and trademark application analysis. Our focus on AI underscores our commitment to harnessing cutting-edge technology to deliver superior solutions.
A.I.